Flyttr™ Dengue Unlocks Decision-Making Capabilities for You
Hyper-local Dengue Risk Intelligence
Pinpoint dengue hotspots down to neighbourhood or building level for targeted interventions.
Dengue Scenario Simulation
Test “what-if” strategies before deploying resources: optimise cost and impact.
Dynamic Dengue Forecasting
Plan weeks ahead with confidence using continuously updated predictions.
On-Demand Dengue Insights
Query the AI assistant for instant answers, generate reports, and visualise risk in interactive maps.
AI-Powered Decision-Making
Flyttr™ Dengue delivers cutting-edge dengue
risk forecasting by integrating two advanced
modelling approaches.
One model uses macro-data and trends to deliver city-wide predictions for Brazil, offering reliable insights weeks in advance to support proactive planning.
The second model leverages satellite imagery and geo-spatial analytics to pinpoint mosquito risk at the neighbourhood and even individual building level, enabling highly targeted interventions.
Both models are validated through robust performance metrics (e.g. confusion matrices, mean errors, area under the curve, and correlation matrices – R coefficient), ensuring the forecasts are accurate and trustworthy.
This technical innovation empowers users with granular, actionable intelligence to stay ahead of outbreaks.
Flyttr™ AI Assistant
The Flyttr™ AI assistant harnesses real-time dengue data and community insights to deliver smart, actionable intervention strategies. With a natural language interface, users can effortlessly query risk levels, generate reports, and simulate tailored scenarios for any location.
Built on a multi-model architecture featuring advanced large language models, Flyttr™ Dengue breaks down complex objectives into practical steps. It integrates robust memory management and tool-use capabilities to interact with APIs, data sources, and enterprise workflows. By connecting seamlessly technical tools, data sources and expert human oversight the system ensures quality and trustworthiness.
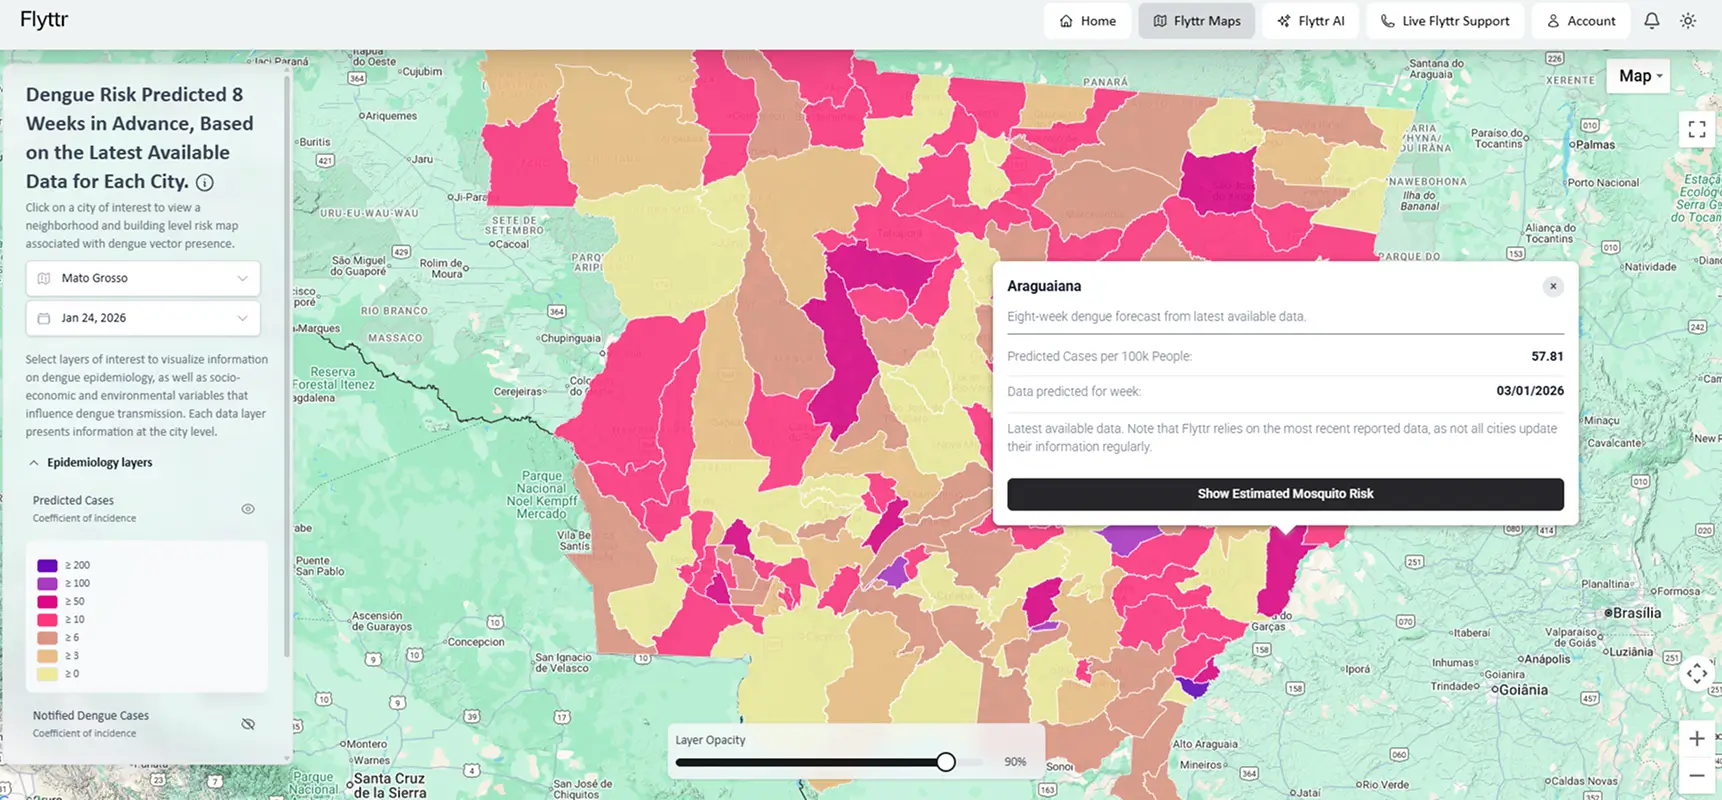
How are our forecasts calculated?
Flyttr™ Dengue combines two powerful modelling systems – macro-level epidemiological forecasting and high-resolution geo-spatial analysis – into a consolidated output that supports precise operational decision-making. This lets users see both overall dengue risk and pinpoint specific hotspots down to neighbourhoods and buildings for targeted action and smart resource use.
Flyttr™ harnesses extensive data from a diverse range of sources, including meteorological, socio-economic, and epidemiological datasets – to train robust machine learning forecasting engine. A combination of satellite and environmental datasets, each offering different levels of detail and update frequencies, are used.
Satellite data sources span across a range of spatial resolutions, from fine-scale datasets to broader environmental layers. Most datasets are updated regularly, with new data available every few days to sometimes a few months, depending on the source.
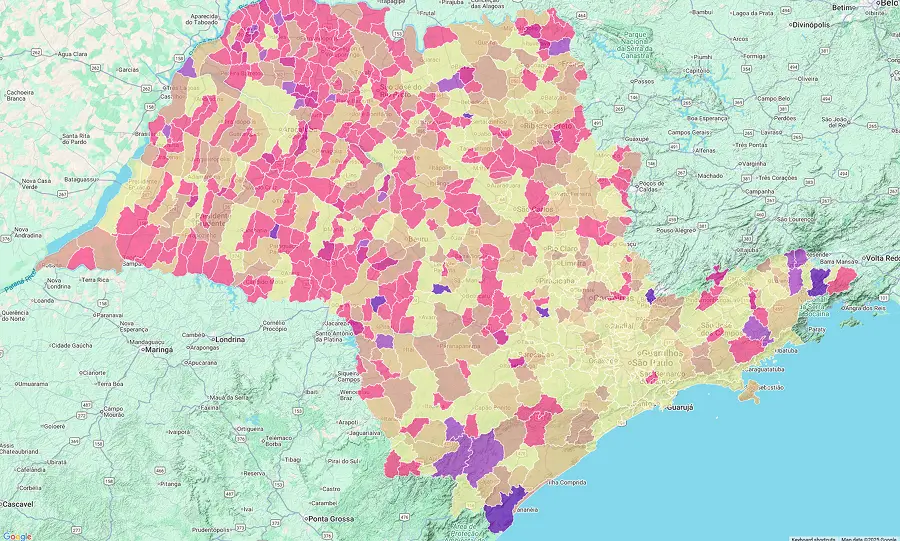
Dengue Forecasts with Unmatched Precision
Flyttr™ Dengue predicts city-wide dengue risk up to 8 weeks ahead using a model trained on over two million data points. By continuously updating with the latest local data the system delivers highly accurate forecasts for more than 5,000 Brazilian cities, empowering proactive public health action.
To make these forecasts possible, the model is designed to analyze how data evolve over time, identifying patterns and relationships between past and present events. This approach makes it possible to understand how factors such as climate, case history, and population dynamics influence future dengue risk.
Flyttr™ was developed to handle complex scenarios in which data exhibit irregular variations or non-linear patterns. By taking into account the historical context of each locality, the system maintains reliable forecasts even when the available data are heterogeneous or incomplete.
Recognizing that data update schedules vary across municipalities, an automated data integration process was developed to continuously incorporate the most recent information available for each city. This process combines highly granular data — such as temperature, precipitation, disease incidence trends, and population indicators — and updates them in a regular and consistent manner.
With this continuous flow of updates and recalibration, Flyttr™’s AI model was designed to keep dengue risk forecasts consistently aligned with the most current and relevant information available for each municipality.
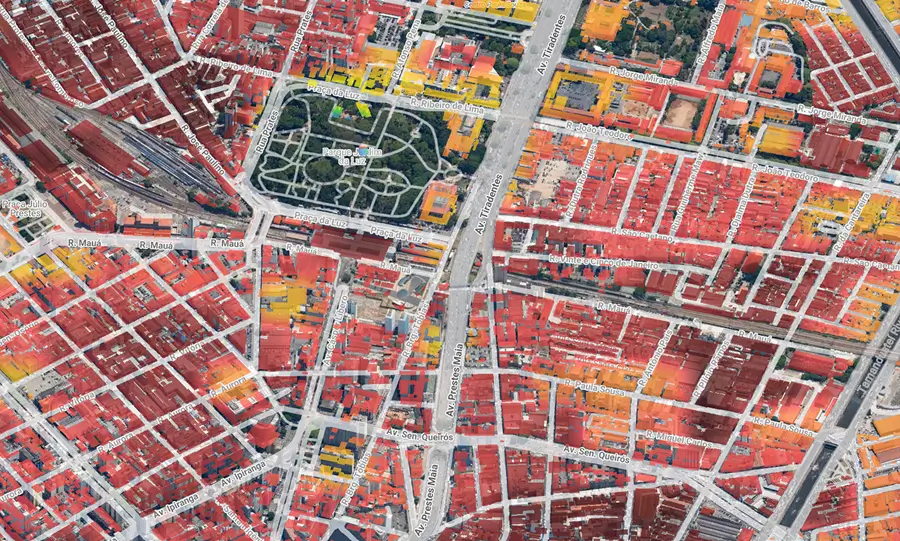
Pinpoint Dengue Mosquito Hotspots for Targeted Intervention
Harnessing advanced ecological modelling and high-resolution satellite data, Flyttr™ Dengue estimates mosquito breeding site suitability down to neighbourhoods and buildings.
How Flyttr™ Dengue stacks up against other dengue forecasting / nowcasting tools
Flyttr™ advances dengue risk management by combining predictive modelling and prescriptive, actionable insights within an intuitive, map-based interface that covers over 5,000 Brazilian cities down to neighbourhood and building level.
Unlike conventional tools limited to reactive dashboards and coarser geographical scales, Flyttr™ uniquely integrates diverse datasets and extends forecasting up to 8 weeks, enabling earlier and more targeted interventions.
And with built-in natural language AI and direct expert consultancy, Flyttr™ empowers users with tailored recommendations and hands-on support, setting a new benchmark for operational effectiveness in dengue control.
Value proposition
Flyttr™
Predictive dengue risk modelling with actionable, prescriptive outputs
Current Tools
Primarily vector surveillance and outbreak dashboards
- Coverage
- 5,000+ cities across Brazil
- Varies, mostly state- and municipal-level only
- User interface
- User-oriented, map-driven
- Analytical and dashboard-style layout
- Data sources
- Epidemiological, climate, socio-economic, environmental, and digital behaviour data. Updated weekly
- Epidemiological, climate, social media data. Updated weekly
- Granularity
- 100M+ buildings mapped, neighbourhood-level
- City or state-level only
- Forecast horizon
- 8 weeks
- Mostly nowcasting only, not forecasting
- AI power
- AI-driven forecasting & Natural language interaction
- Forecasts only. Natural language interaction not available
- Prescriptive analytics
- Highly specific Al- and expert-driven action recommendations
- Not available
- Human touch
- Flyttr™ team available for personalised consultancy sessions
- Not available
How Flyttr™ Dengue Can Help You – Select Case Studies
Case Study 1:City Health Authority
Flyttr™ can help metropolitan health departments by enabling the early identification of potential dengue hotspots, often up to two weeks before spikes in cases. With these insights, teams can reallocate spraying resources and enhance community outreach in targeted zones, supporting efforts to reduce the incidence of dengue compared to previous seasons.
Case Study 2:Private Sector Partnership
Flyttr’s hyper-local forecasts can support companies to better protect their workforce and serve their customers. By providing timely information, organisations are better equipped to adjust delivery routes and implement preventive measures in high-risk areas, reducing absenteeism and strengthening operational resilience.
Case Study 3:National Policy Planning
At a national level, health ministries may integrate Flyttr™ into disease surveillance systems to access extended forecasts. Such integration can help optimise the allocation of vaccines and vector control budgets, contributing to enhanced national preparedness and long-term resilience.
Ready to Act?
Flyttr™ Dengue turns complexity into clarity.
Discover how Flyttr™-powered decision-making can transform dengue control in your community.